The number of students ages 3–21 who received special education (SPED) and/or related services in 2022-23 was 7.5 million, or about 15% of U.S. public school students. It is estimated that the current number exceeds 8.0 million. This reflects a sizable increase over the last decade. In 2012–13, about 6.4 million public school students, or about 13%, received SPED or 504 services. Both these numbers are dramatically higher than the 1976–77 figure of 3.6 million students receiving special education services (National Center for Education Statistics, 2024a).
The percentages of students receiving SPED services by state are shown in the map below. As can be seen, the State of Maryland has one of the lowest percentages at 13%.
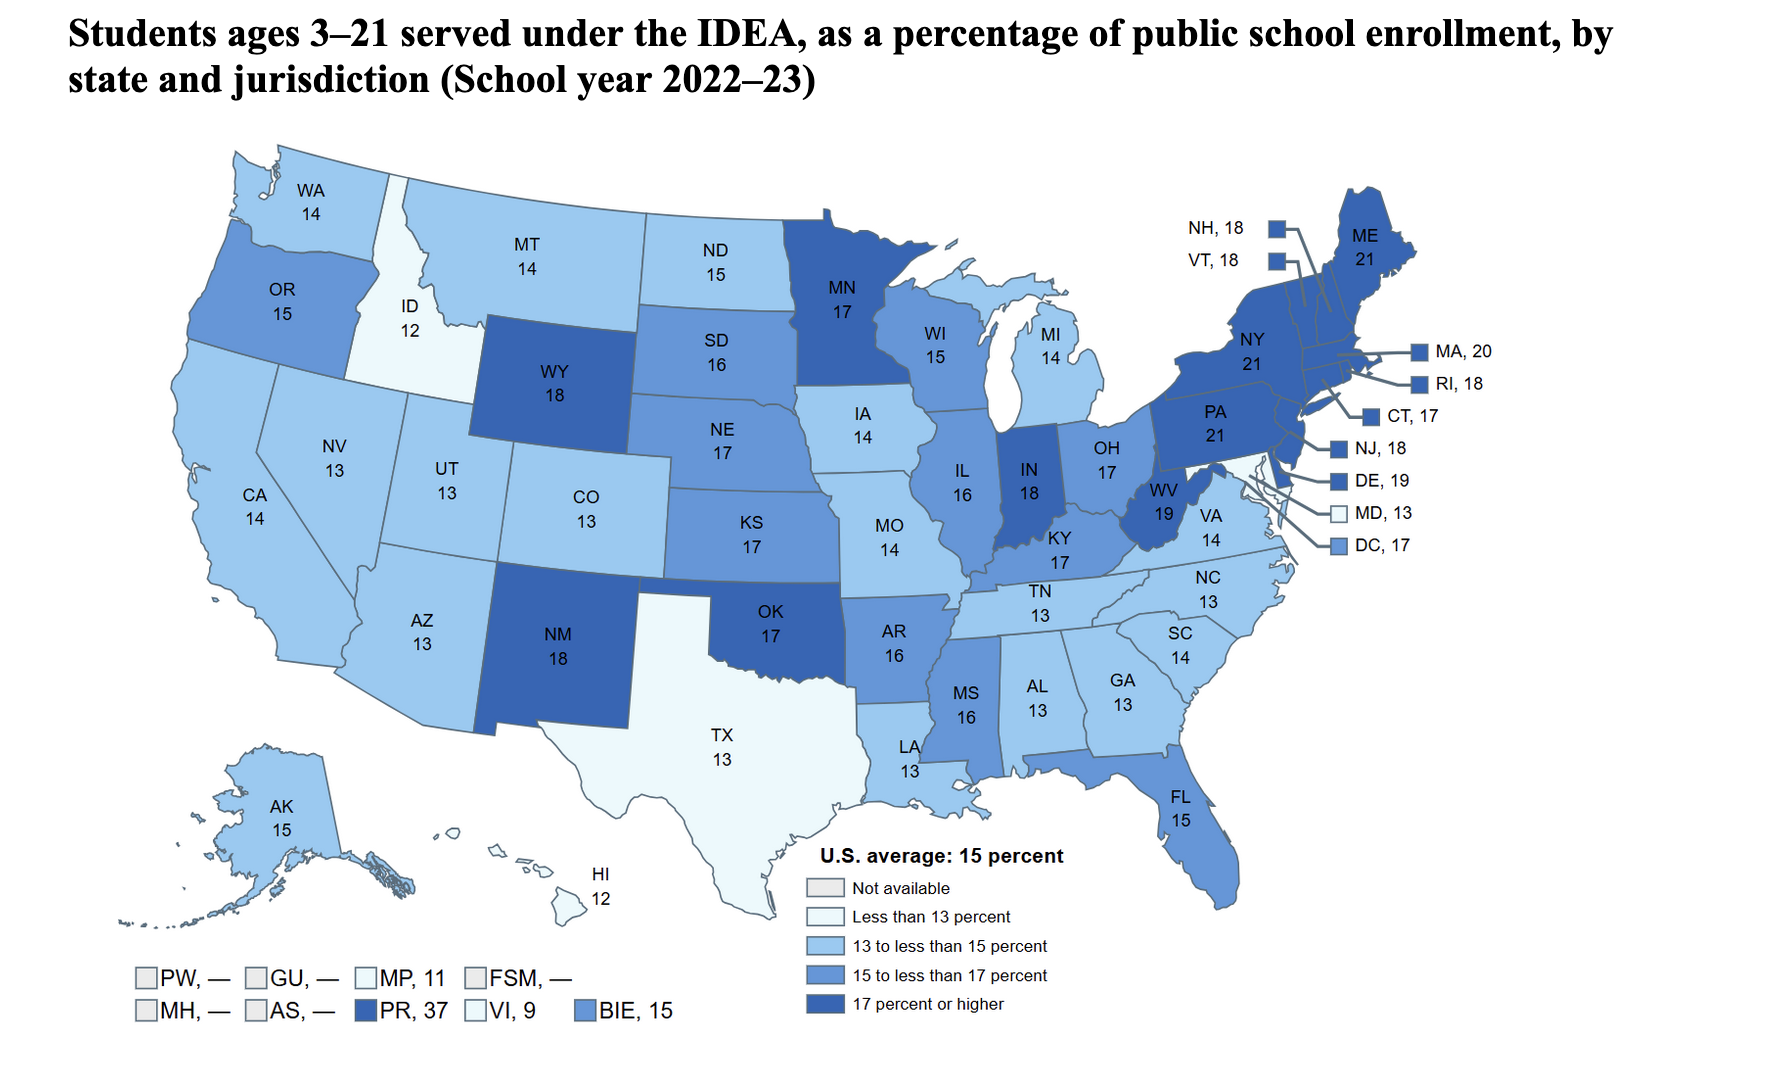
SOURCE: U.S. Department of Education, Office of Special Education Programs, Individuals with Disabilities Education Act (IDEA) database, retrieved October 13, 2023, from https://data.ed.gov/dataset/idea-section-618-state-part-b-child-count-and-educational-environments/resources. National Center for Education Statistics (NCES), Common Core of Data (CCD), “State Nonfiscal Survey of Public Elementary/Secondary Education,” 2022–23. See Digest of Education Statistics 2023, table 204.70.
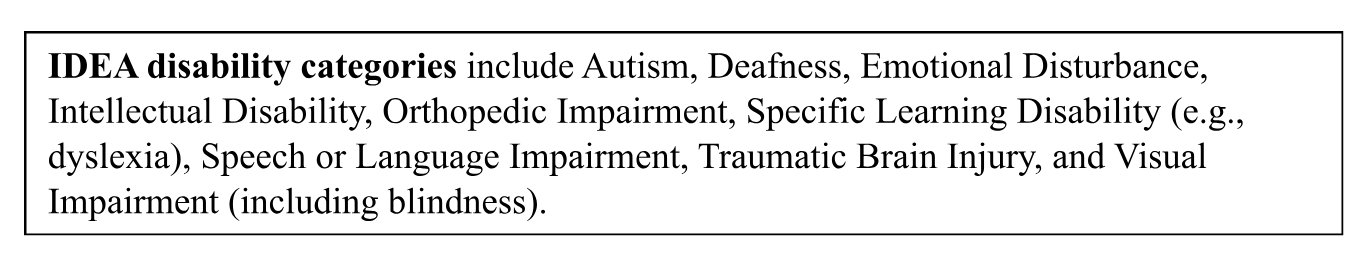
April is Autism Awareness Month, and today in the U.S., more than 1 million students ages 3–21 have been identified with autism spectrum disorder (ASD). However, autism is just one of 13 disability categories outlined by the Individuals with Disabilities Education Act (IDEA) under which a student may qualify for special education services.
In addition, students who do not meet the IDEA criteria for special education services may still receive supports under Section 504 of the Rehabilitation Act of 1973, which typically provides accommodations rather than special education services. (NCES, 2024a).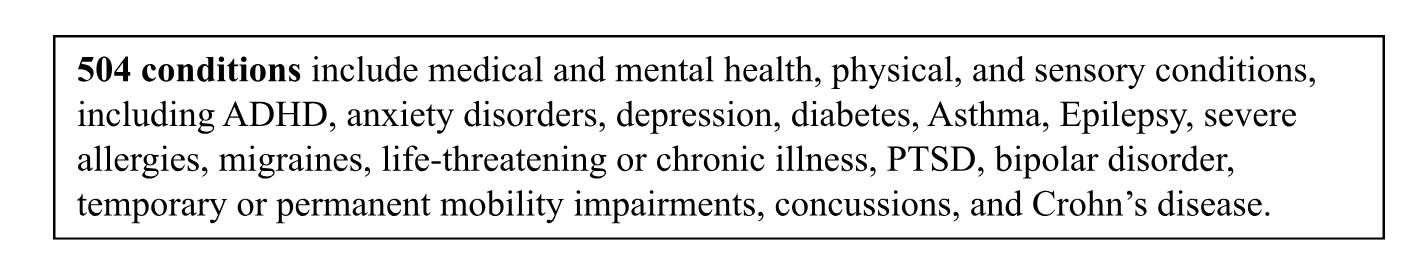
This month’s Equity Express Director’s Desk article, Special Education Demands, Shortages, and Burnout, discusses the expanded service categories, the increased demand for services, and the shortage of qualified teachers and paraprofessionals. Here we broaden that discussion to include 504 services and the many other professionals who serve these children.
The reasons for the dramatic increases in the number of children identified for SPED services are, in large measure, tied to the passage of the 1975 Education for All Handicapped Children Act, which later became the Individuals with Disabilities Education Act (IDEA). In addition, awareness about disabilities among parents and educators has increased, and today, there are better diagnostic and screening tools. Students who might previously have been labeled as “slow learners” or “behavior problems” are now identified with specific disabilities, such as autism spectrum disorders, ADHD, speech or language impairment, and a specific learning disability. For example, autism was not widely recognized in schools in the 1970s, but it is now a major category (Friend & Bursuck, 2019).
Many of the children who received SPED and/or related services are being helped by amazing classroom and special education teachers. However, many other professionals and specialists also provide services to children every day, particularly those children with the greatest needs and those requiring highly specialized services. These include nurses, speech-language pathologists (SLPs), psychologists, counselors, social workers, reading and math specialists, and paraprofessionals. These professionals not only provide essential support but also often form meaningful, life-changing relationships with students—connections that can be harder to establish in larger classroom settings.
To keep pace with the growing demand for SPED teachers and other professionals, school districts have employed various strategies. These include developing “grow-your-own” programs, alternative certification pathways, and offering financial incentives such as signing bonuses or loan forgiveness. In addition, schools often expand paraprofessionals’ and instructional aides’ responsibilities, contract with outside providers or tele-service companies for specialists such as speech-language pathologists, and focus on retention strategies, such as mentoring and reduced caseloads. For example, the 2025 ASHA survey reports that 37% of SLPs use tele-practice in their work (ASHA, 2025).
Unfortunately, while the number of students eligible for services has increased, the number of SPED teachers has not increased fast enough to keep pace with this growing need.
A nationwide 2022 survey of schools found that vacancies in special education were nearly double those in other subject areas. The survey also found that 65% of public schools in the United States reported being understaffed in special education (Bodenhamer, 2023). According to the NCES (2024a), on average, public schools reported filling 79 percent of vacant SPED teaching positions before classes resumed in the fall. However, both elementary and middle schools reported having difficulty filling a special education teaching vacancy with a fully certified teacher (74%). The rates for public schools with high percentages of minority students and for schools in high-poverty neighborhoods were lower at 72%. In other words, in these districts, nearly one-third of the positions are vacant when school begins.
The number of professionals providing special education and related services, particularly specialists such as SLPs, social workers, and occupational therapists, has generally increased significantly over the past decade. The table below shows the estimated percentage increases from 2012–13 to 2022–23 (NCES, 2024b).
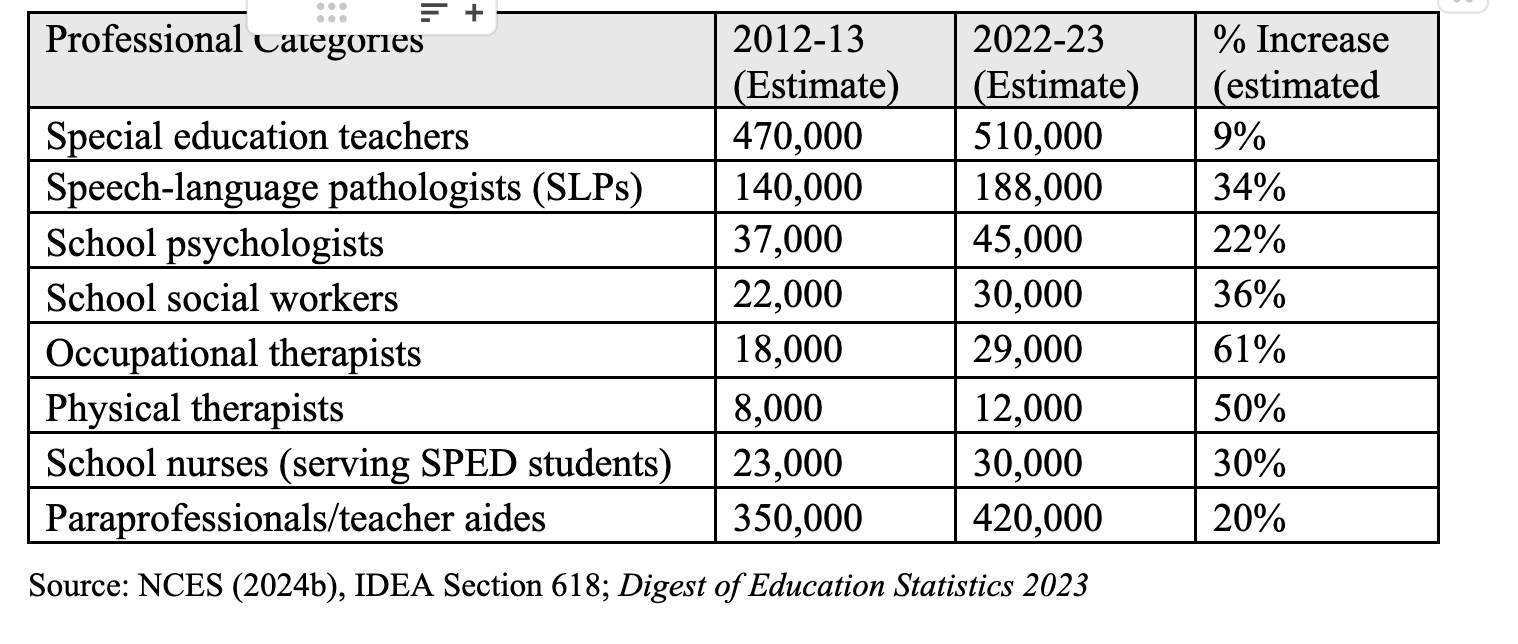
As can be seen, the slowest growth rate was for SPED teachers, which contributes to the widely reported teacher shortages in this field. Studies of SPED teacher shortages have identified a number of factors, including lack of administrative support and training, increased workloads, challenging school working conditions, and the challenges of working with children, adolescents, and young adults with cognitive, emotional, and/or physical challenges (Billingsley & Bettini, 2019; Mathews, et al., 2021; Mason-Williams et al., 2020; Feng & Sass, 2013; Walker, 2017; Dewey et al., 2017).
Of course, recruiting and retention are not the only challenges confronting special educators. There are many others, including preventing the disproportionate placement of minority students, providing the least restrictive environment (LRE) as required by federal law, and effectively implementing inclusion as an LRE strategy.
The U.S. Department of Education requires every state to monitor whether certain racial or ethnic groups are over- or under-represented in special education identification, placement, or discipline under the Individuals with Disabilities Education Act. Many schools and districts struggle to meet these requirements even as programs such as Coordinated Early Intervening Services (CEIS), Multi-Tiered Systems of Supports (MTSS), and Positive Behavioral Interventions and Supports (PBIS) provide early academic and behavioral support (Mason-Williams et al., 2020; Sullivan & Bal, 2013).
Challenges to implementing the least restrictive environment (LRE) include limited teacher training, staffing shortages, insufficient collaboration time, large class sizes, difficulty meeting diverse student needs, funding constraints, and disagreements about appropriate placement (Kurth et al., 2014).
The graph below shows the breakdown of school-age students served under IDEA by the amount of time they spend in general education classes. As shown, in 2022-2023, approximately two-thirds (66%) of students with disabilities (≈5 million students) were served in general education classes at least 80% of the day. About 16% of students (≈1.2 million) were served in general education classes for 40–79% of the day, and about 14% (≈1.0 million) were served in general education classes for <40% of the day. In addition, about 4% (≈300,000 students) are served each day in separate schools or residential programs (NCES, 2024d).

National Center for Education Statistics (2024d). Students With Disabilities. Condition of Education. U.S. Department of Education, Institute of Education Sciences. Retrieved [date], from https://nces.ed.gov/programs/coe/indicator/cgg.
Many of these issues are central to the work and research conducted by the NCEED staff and faculty, particularly by the NCEED Inclusion and Access team. This month’s edition of the Equity Express includes an article by Dr. Elizabeth Morgan, Associate Professor in Morgan State University’s Department of Advanced Studies, Leadership, and Policy, and a NCEED research faculty member, focused on inclusion and access.
——————————————————-
References:
ASHA, 2025. American Speech-Language-Hearing Association. ASHA 2025 SLP Health Care Survey: Caseload characteristics. www.asha.org/
Billingsley, B, Fall, A., and Williams, T., 2006. “Who is Teaching Students with Emotional Disorders? A Profile and Comparison to Other Special Educators,” Behavioral Disorders 31(1): 252–264.
Billingsley, B., & Bettini, E. (2019). Special education teacher attrition and retention: A review of the literature. Review of educational research, 89(5), 697–744.
Brusca-Vega, R. (2024). Understanding Disability Categories
Bureau of Labor Statistics, U.S. Department of Labor, Occupational Outlook Handbook, Special Education Teachers, https://www.bls.gov/ooh/education-training-and-library/special-education-teachers.htm (March 02, 2026).
Bureau of Labor Statistics, U.S. Department of Labor, Occupational Outlook Handbook, Speech-Language Pathologists.
https://www.bls.gov/ooh/healthcare/speech-language-pathologists.htm
CDC, 2025. Autism Partner Toolkit. Public Health. https://www.cdc.gov/autism/php/toolkit/index.html
Christensen, D. L. (2016). Prevalence and characteristics of autism spectrum disorder among children aged 8 years—autism and developmental disabilities monitoring network, 11 sites, United States, 2012. MMWR. Surveillance summaries, 65.
Dewey, J., Sindelar, P., Bettini, E., Boe, E., Rosenberg, M., and Leko, C., 2017. Explaining the Decline in Special Education Teacher Employment from 2005 to 2012. Exceptional Children, v83 n3 p315-329
Feng, L., & Sass, T. R. (2013). What makes special-education teachers special? Teacher training and achievement of students with disabilities. Economics of Education Review, 36, 122–134.
Francisco, M. P. B., Hartman, M., & Wang, Y. (2020). Inclusion and special education. Education Sciences, 10(9), 238.
Friend, M., & Bursuck, W. (2019). Including Students with Special Needs: A Practical Guide for Classroom Teachers (6th ed.). Pearson.
IDEA, n.d. IDEA Sec. 300.8 Child with a disability. https://sites.ed.gov/idea/regs/b/a/300.8.
Kurth, J. A., Morningstar, M. E., & Kozleski, E. B. (2014). The persistence of highly restrictive special education placements for students with low-incidence disabilities. Research and Practice for Persons with Severe Disabilities, 39(3), 227–239.
Lipkin, P. & Okamoto, J., 2015. Council on Children with Disabilities and Council on School Health. The Individuals with Disabilities Education Act (IDEA) for children with special educational needs. Pediatrics, 136(6).
Lipscomb, S., Hamison, J., Liu Albert, Y., Burghardt, J., Johnson, D. R., & Thurlow, M. (2017). Preparing for Life after High School: The Characteristics and Experiences of Youth in Special Education. Findings from the National Longitudinal Transition Study 2012. Volume 2: Comparisons across Disability Groups. Full Report. NCEE 2017-4018. National Center for Education Evaluation and Regional Assistance.
Mason-Williams, L., Bettini, E., Peyton, D., Harvey, A., Rosenberg, M., & Sindelar, P. T. (2020). Rethinking shortages in special education: Making good on the promise of an equal opportunity for students with disabilities. Teacher Education and Special Education, 43(1), 45–62.
Mathews, H. M., Lillis, J. L., Bettini, E., Peyton, D. J., Pua, D., Oblath, R., … & Sutton, R. (2021). Working conditions and special educators’ reading instruction for students with emotional and behavioral disorders. Exceptional Children, 87(4), 476–496.
Mathews, H. M., Lillis, J. L., Bettini, E., Peyton, D. J., Pua, D., Oblath, R., … & Sutton, R. (2021). Working conditions and special educators’ reading instruction for students with emotional and behavioral disorders. Exceptional Children, 87(4), 476–496.
McLeskey, J., Council for Exceptional Children, & Collaboration for Effective Educator Development, Accountability and Reform. (2017). High-leverage practices in special education.
Moriña, A. (2019). Inclusive education in higher education: challenges and opportunities. Postsecondary educational opportunities for students with special education needs, 3-17.
National Center for Education Statistics, 2024a. Students With Disabilities. Condition of Education. U.S. Department of Education, Institute of Education Sciences. Retrieved [date], from https://nces.ed.gov/programs/coe/indicator/cgg.
NCES, 2024b. National Center for Education Statistics (2024), IDEA Section 618 personnel data; Digest of Education Statistics 2023 tables on special education personnel.
NCES, 2024c. Most U.S. public elementary and secondary schools faced hiring challenges for the start of the 2024–25 academic year. https://ies.ed.gov/learn/press-release/most-u-s-public-elementary-and-secondary-schools-faced-hiring-challenges-start-2024-25-academic-year.
National Center for Education Statistics (2024d). Students With Disabilities. Condition of Education. U.S. Department of Education, Institute of Education Sciences. Retrieved [date], from https://nces.ed.gov/programs/coe/indicator/cgg.
Sullivan, A. L., & Bal, A. (2013). Disproportionality in special education: Effects of individual and school variables on disability risk. Exceptional children, 79(4), 475–494.
Walker, T., 2017. neaToday. Survey: Quality Professional Development Still Out of Reach for Teachers